DNA Analysis
Base Composition Analysis
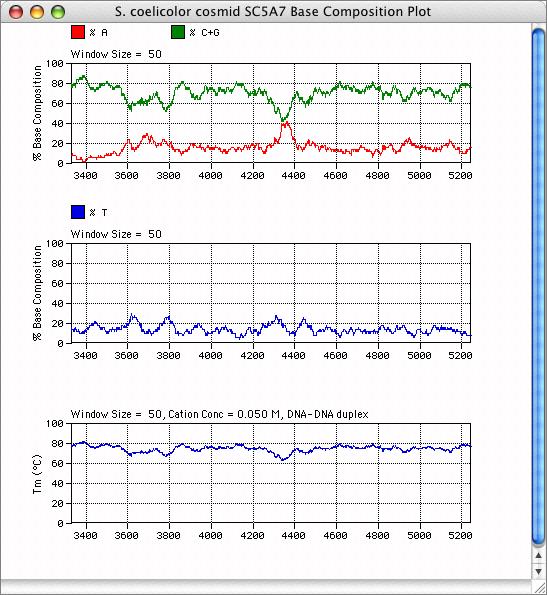
MacVector lets you plot and/or list a wide variety of base composition statistics, all driven from a single easy to use dialog. You can list the total mono-, di- and tri-nucleotide frequencies within a selected segment of DNA and plot the occurrence of individual di- or tri-nucleotides (e.g. CpG dinucleotides) as histograms. You can also plot base composition across a DNA segment, combine plots onto a single graph and zoom in to view regions of interest in more detail. You can also plot and list melting temperature statistics under a variety of experimental conditions.

Restriction Enzyme Searches
MacVector can search DNA sequences for restriction sites using any or all of the enzymes from the REBASE Restriction Enzyme Database (http://rebase.neb.com). It maintains lists of enzymes in individual files representing not only all of the enzymes in the database, but also broken out my manufacturer. You can duplicate and/or edit these files to create your own custom lists of enzymes or even add new specificities. You can also select individual enzymes within each file to allow fine control over the enzymes used in a search.
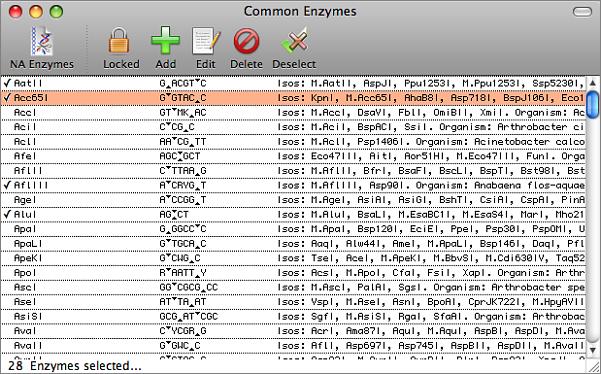

When you perform a search, you can not only choose the enzyme file you want to use, but you can also choose how you want the search to be performed - you can simply search using all enzymes in the file, or just the selected enzymes, or you can choose combinations of other criteria such as site size, end structure or number of cuts in the molecule. Once the scan has completed, you can apply additional post-processing filtering to help identify cut sites of interest and what information you would like to display.
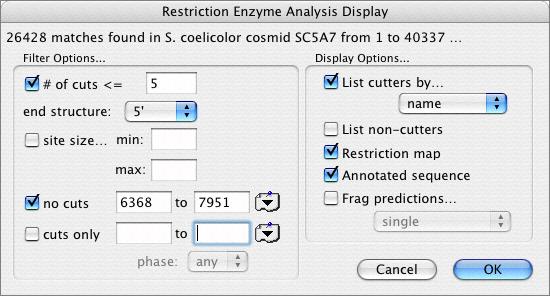

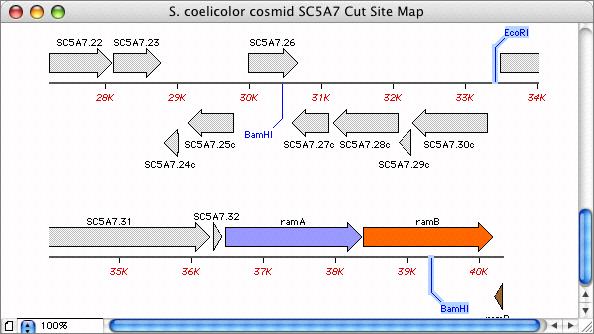
The predicted cut sites can be listed in a variety of ways and displayed on an text-based annotated sequence as well as an interactive graphical map of the sequence. You can also choose to display all of the enzymes that do not cut the selected DNA segment and lists of the fragments that would be produced by all combinations of single and double digests.

DNA Subsequence Searches
MacVector can search for DNA subsequences using a very similar approach to the Restriction Enzyme searching functionality. However, you can use subsequences with complex patterns for the search - each pattern can have up to three distinct segments, separated by variable inter-segment regions, and you can control the overall similarity required for a match as well as defining residues which must be 100% conserved. MacVector ships with a number of collections of interesting sites, including the popular tfsites Transcription Factor database (http://www.ifti.org).
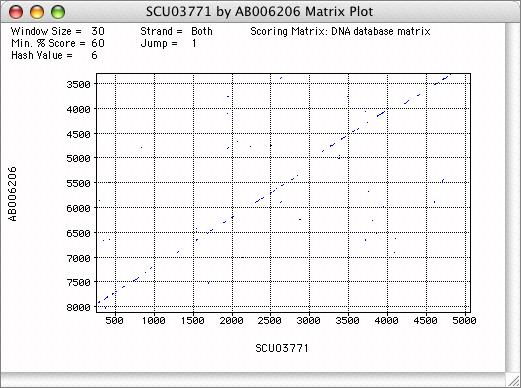
Dot Plot Sequence Comparisons
You can use Dot-plot comparisons to identify weak relationships between sequences or to identify repeat sequences. MacVector lets you not only compare pairs of DNA sequences, but also a DNA sequence with a protein sequence. The output can be viewed graphically and also as a text view where the segments of similarity from the second sequence are displayed aligned underneath the annotated first sequence.

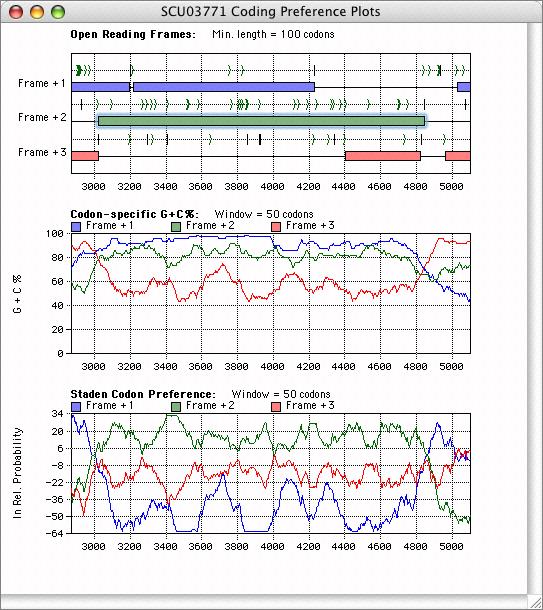
Nucleic Acid Toolbox
MacVector bundles a number of algorithms useful for identifying protein coding open reading frames into a single Coding Preference Toolbox. It includes a simple algorithm for displaying open reading frames longer than a specified number of residues in addition to plots of codon-specific G+C%, Fickett's testcode, Uneven Positional Base Frequencies, Positional Base Preference and three Codon Preference algorithms (MacVector, Staden and Gribskov) that plot coding probability using pre-calculated organism-specific codon usage tables. The results of each algorithm are displayed on an interactive graphical display that lets you zoom in all the way to the residue level if required and lets you select potential open reading frames to translate by clicking on start codons or on entire open reading frames.

|